Playing with Fiducial Markers and AprilTags
Recently, I have been organizing all of the parts and pieces of my partially finished projects so I can go back to projects more easily. This started as a simple goal - keep all of my work in boxes, keep the boxes labeled, and keep the boxes in a place where they are easy to get to. I have mountains of leftover parts I’ve accumulated over the years, and I really need a better solution.
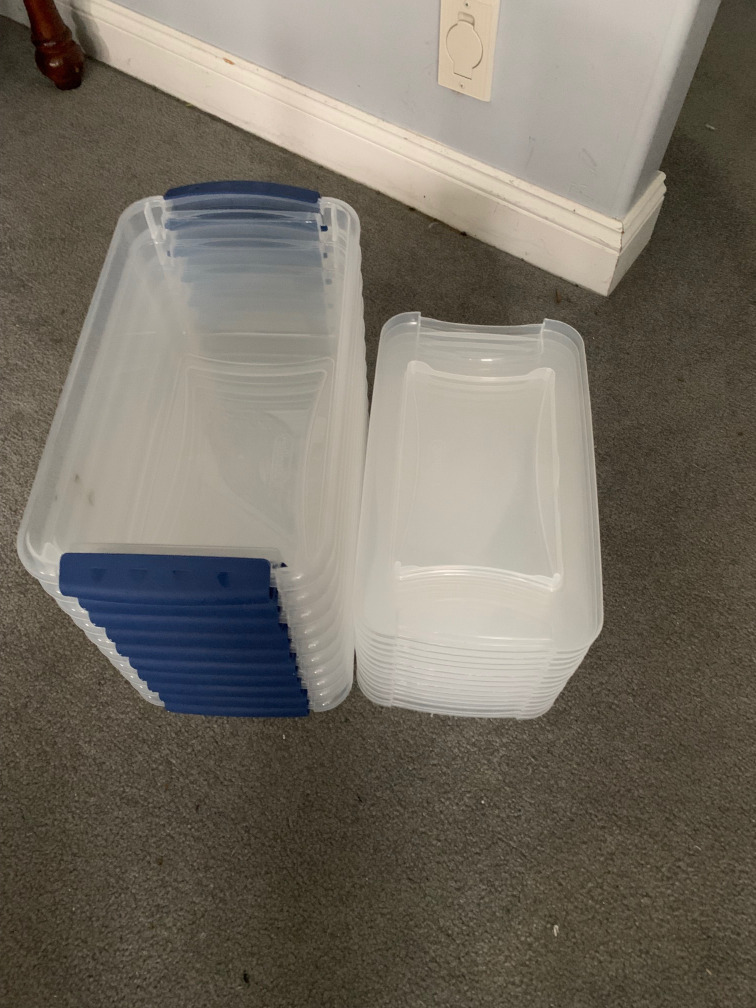
The first solution was simple - buy a bunch of smaller boxes. I primarily had 18 gallon storage totes and shelving designed to hold them, but they are way too big for any project and end up filled with everything. I decided on smaller 7 quart (sorry metric friends) bins with latching lids, as the perfect size for most of the electronics projects I normally work on.
Of course, I could just use my label maker to print labels for each bin, and manually search for them on a shelf. But, I could also take a much cooler approach and design something to track all of the bins for me. Is it more useful than manually reading all of the labels on the shelf? Maybe not, but sometimes the fun of the project is in building it more than using it.
Enter my new project - Storage Tracker
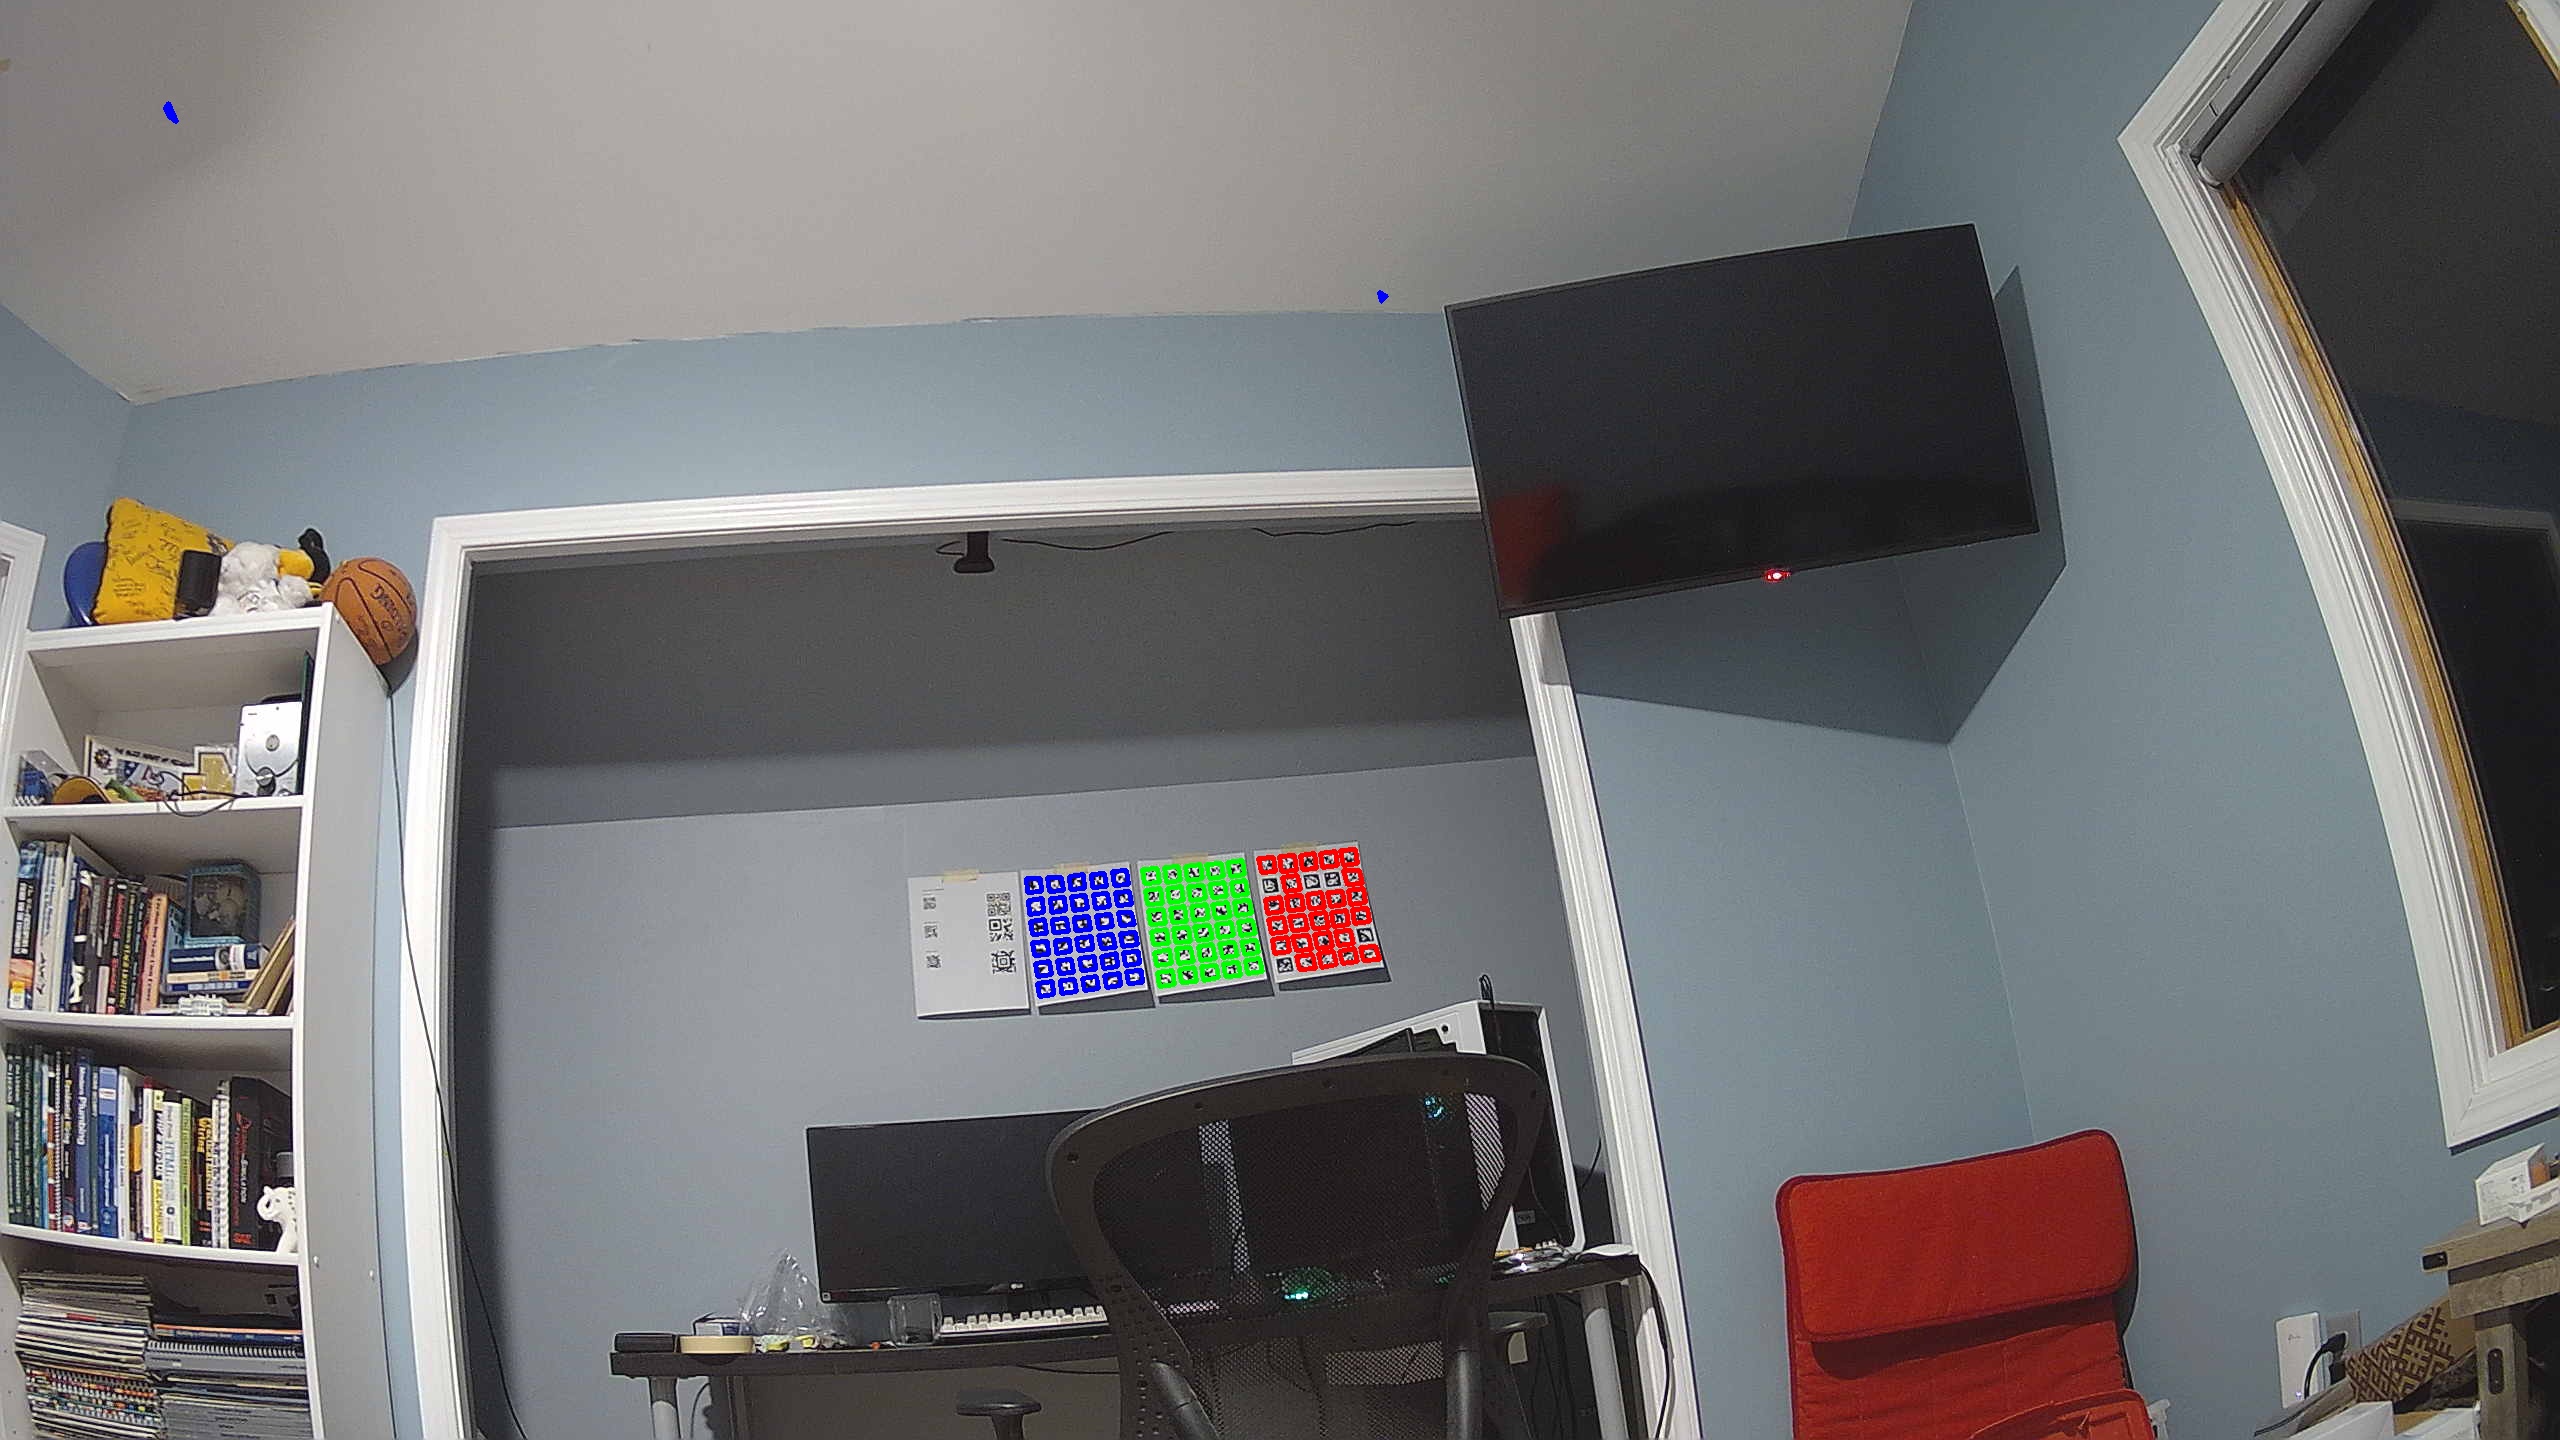
As a result of this, my wall is now plastered with grids of fiducial markers, reminiscent of the early Virtual Reality demos at VALVe where the entire room had giant block codes scattered all over.
Initial Findings⌗
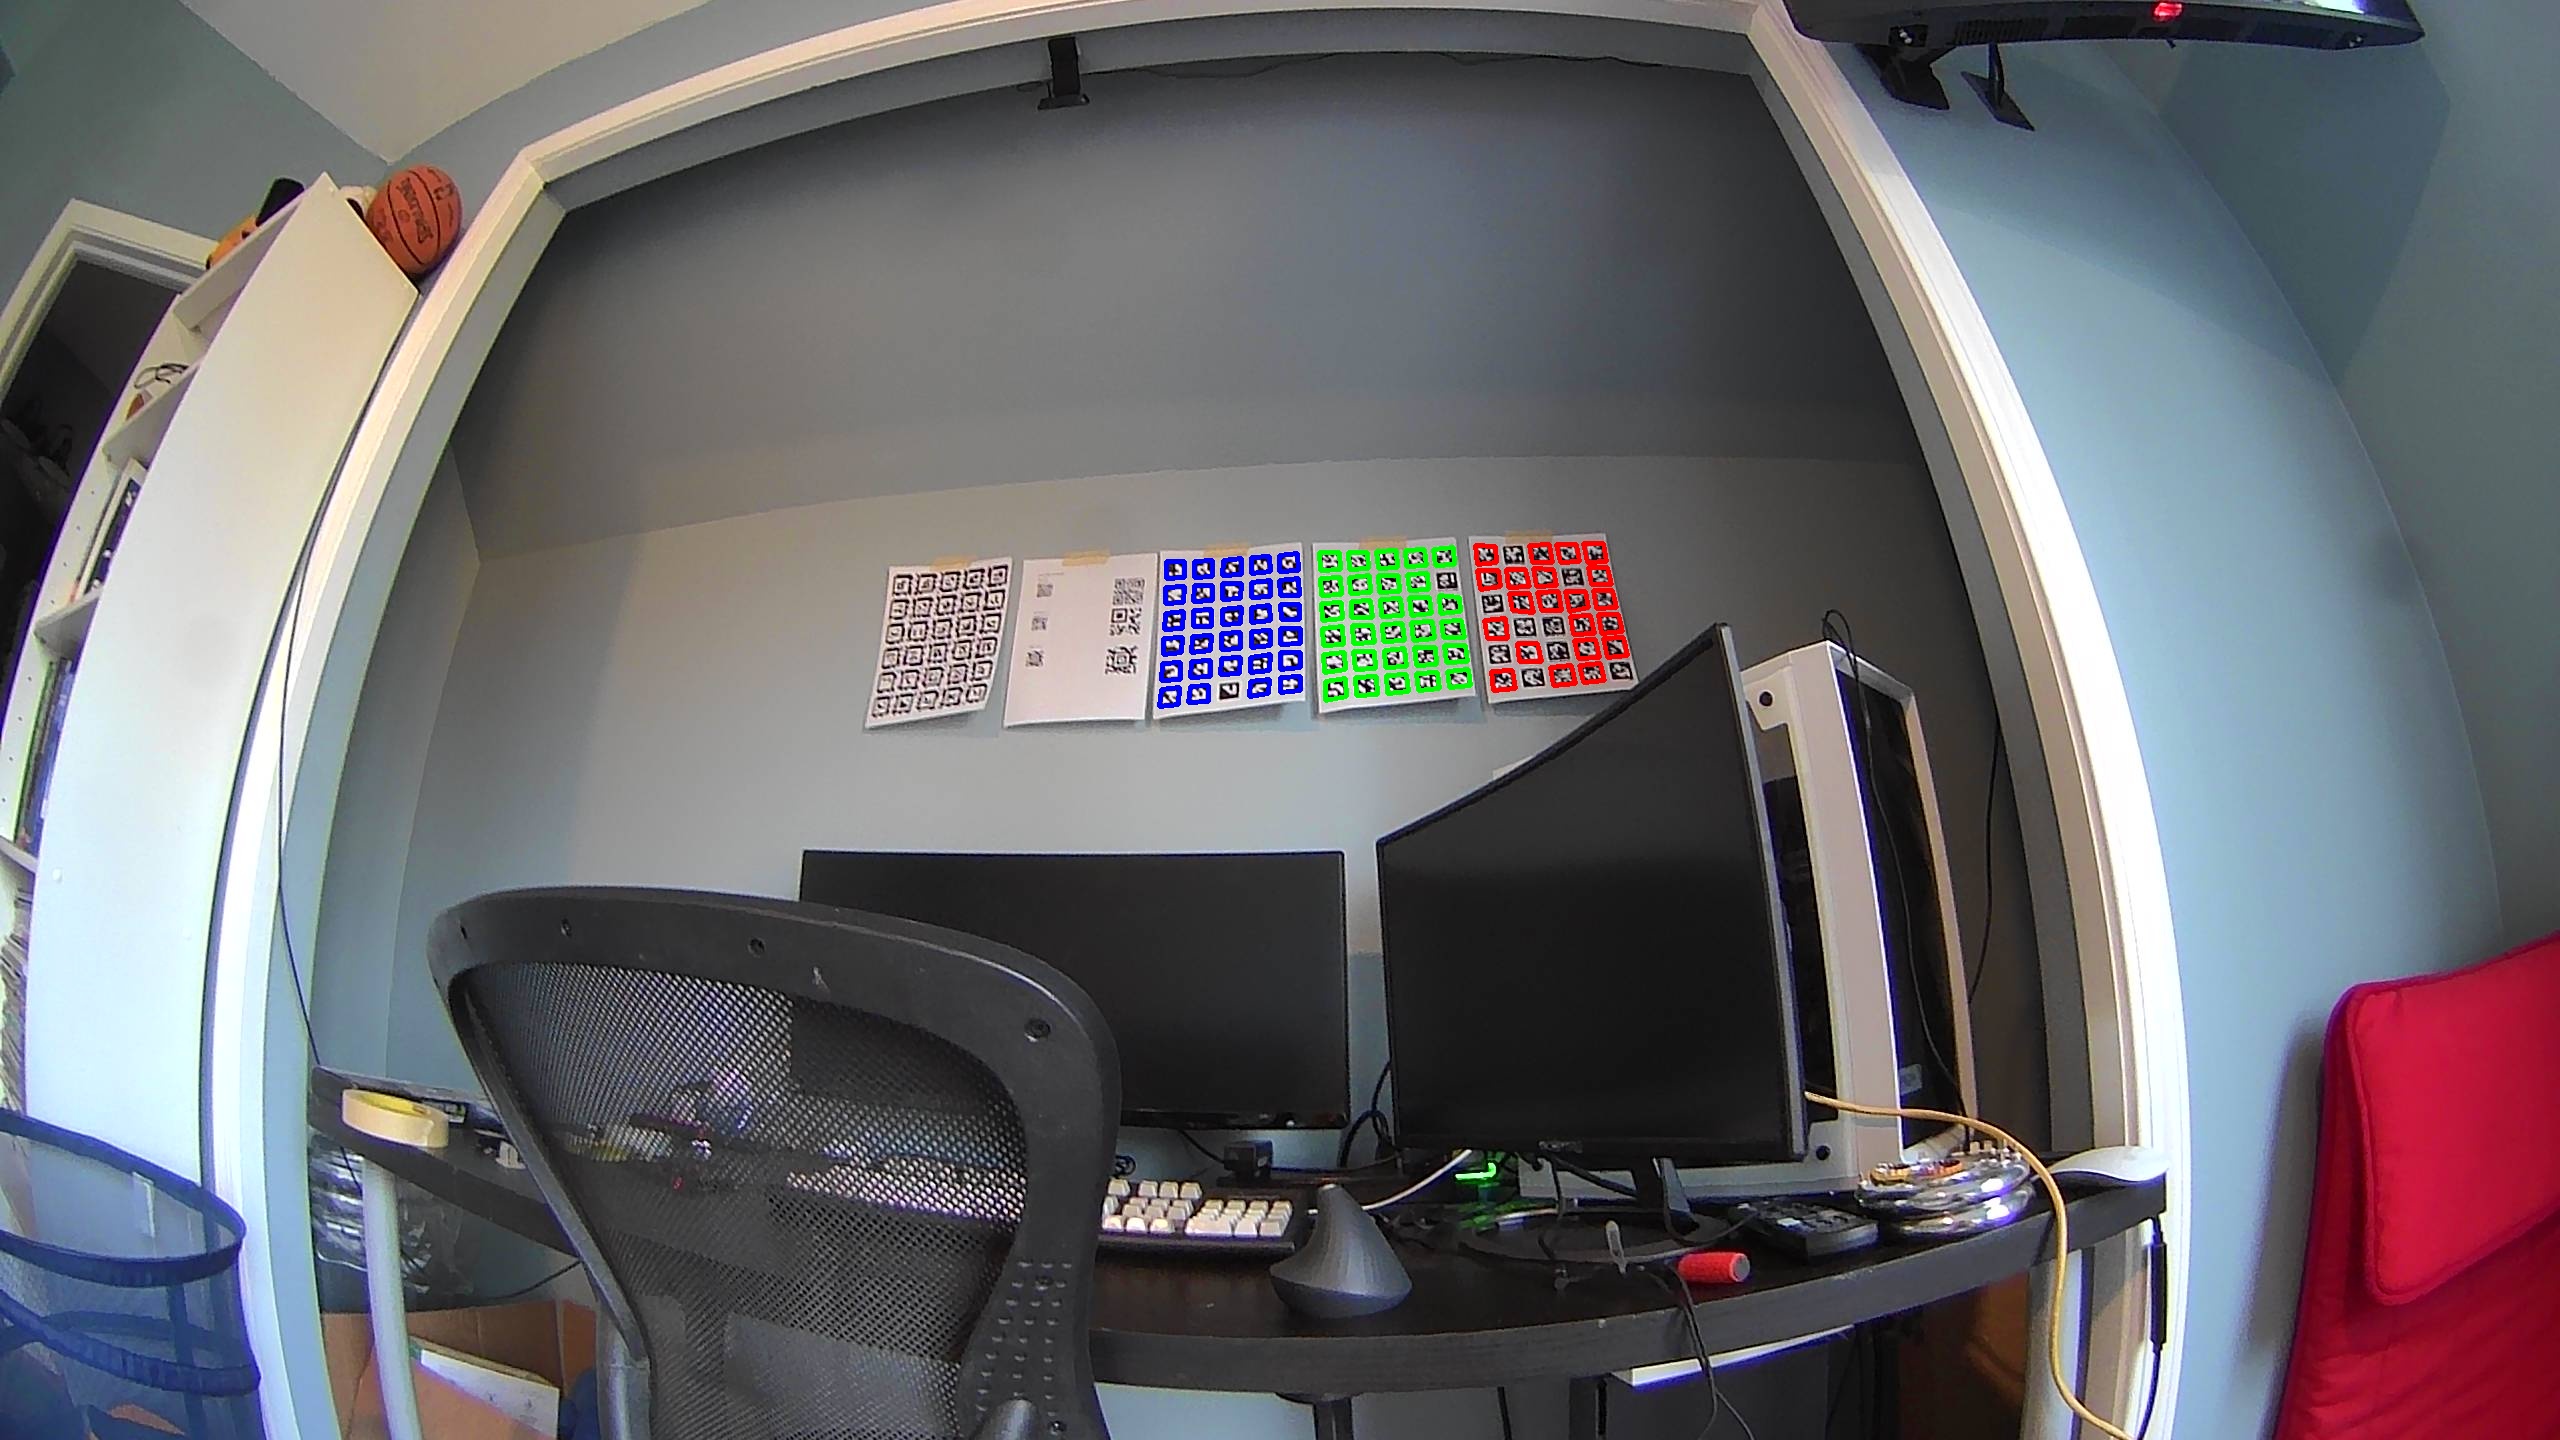
I have 4 types of AprilTags here - I printed a sheet of 30x tags for each type (tag16h5, tag25h9, tag36h11, tagStandard52h13). These are roughly 1.5" square not including the keep out area, so these are smaller than the QR codes I tested earlier. I started with only the first 3 types (which are 4x4, 5x5, and 6x6 pixels active area plus a 1px solid border), which support up to 30, 35, and 998 unique codes respectively. I’d ideally like to use the smallest number of pixels possible for the number of boxes I have. Since I’m likely to expand past 30 and 35 boxes, the tag36h11 seems like the minimum for me, but maybe someday one of you will use my (eventual) software to manage a much larger storage system and the tagStandard52h13 with its 57,714 total tags will required for you. Another approach is to use two different tags (i.e. tag16h5 + tag25h9, which would be 30 * 35 or 1050 possibilities), since two tags side by side might fit better on a box than a single larger tag. Also, especially with the smallest tag16h5, the detector often detects blurred versions of larger tags (hence finding ~35 tags when there are only 30 in the image). Ideally you’d stick to only one type of tag in your entire inventory to simplify this. All of this must be considered when choosing the tag system to use for your storage tracker.
I accidentally printed the tagStandard52h13 incorrectly, so the printer cropped off the right most row of pixels, so 6 of the tags shouldn’t read correctly. It’s stil much harder for that tag type to be detected than the other 3 tag types at the distance I’d like to place my camera.
The Test Code⌗
At this point, I’m taking still images from the cameras and running them through a python script to process them and export a new modified image. I’m running this on Ubuntu, so no guarantees about Windows or macOS. You need to install AprilTags and compile it with all of the python options working (it will let you know if configure can’t find python modules it needs, and thus won’t build the python bindings). You also need the pip module opencv-contrib-python to get the OpenCV python bindings.
import cv2
import numpy as np
from apriltag import apriltag

#Draw function
def display(im, detections, color):
    for detect in detections:
        #Extract points from detection data
        points = detect['lb-rb-rt-lt']
        n = len(points)
        # Draw the four lines making up the points
        for j in range(0,n):
            p1 = tuple([int(cell) for cell in points[j]])
            p2 = tuple([int(cell) for cell in points[(j+1)%n]])
            cv2.line(im, p1, p2, color, 3)

#Read in the file as both color (for display) and grayscale (for analysis)
fname = "tags.jpg"
imagecolor = cv2.imread(fname)
image = cv2.imread(fname,cv2.IMREAD_GRAYSCALE)

#Create a detector for each tag type
detector1 = apriltag("tag16h5")
detector2 = apriltag("tag25h9")
detector3 = apriltag("tag36h11")
detector4 = apriltag("tagStandard52h13")

#Run each detector on the grayscale image - comment out the ones you don't expect
detections1 = detector1.detect(image)
detections2 = detector2.detect(image)
detections3 = detector3.detect(image)
detections4 = detector4.detect(image)

#Print the total number of detections - only expect 24 of 52h13 since that one got messed up by the printer
print("Total ",len(detections1)," detections tag16h5 (expect 30)")
print("Total ",len(detections2)," detections tag25h9 (expect 30)")
print("Total ",len(detections3)," detections tag36h11 (expect 30)")
print("Total ",len(detections4)," detections tagStandard52h13 (expect 30, or 24)")

#Add overlays for each of the detection lists in a different color
display(imagecolor,detections1,(255,0,0))
display(imagecolor,detections2,(0,255,0))
display(imagecolor,detections3,(0,0,255))
display(imagecolor,detections4,(255,0,128))

#Write the output file back
cv2.imwrite("output.jpg",imagecolor)
My goal going foward is to make blog post updates like this instead of massive project pages, since I have a lot of projects that I work on a lot of and keeping this documentation thorough and clearly written helps me keep track of everything I tried.