Packet Capture in Proxmox
When you’re troubleshooting network issues, it’s often extremely helpful to view and analyze packet captures. The de-facto tool for this is the open-source Wireshark, which has an extensive protocol decoding capability. So, as a Proxmox user, it would be nice to be able to analyze VM networking issues using Wireshark.
Unfortunately for us, Wireshark is a graphical application and Proxmox’s web UI doesn’t support it. However, we can use the command-line tool tcpdump to create a pcap file, and then analyze that file in Wireshark.
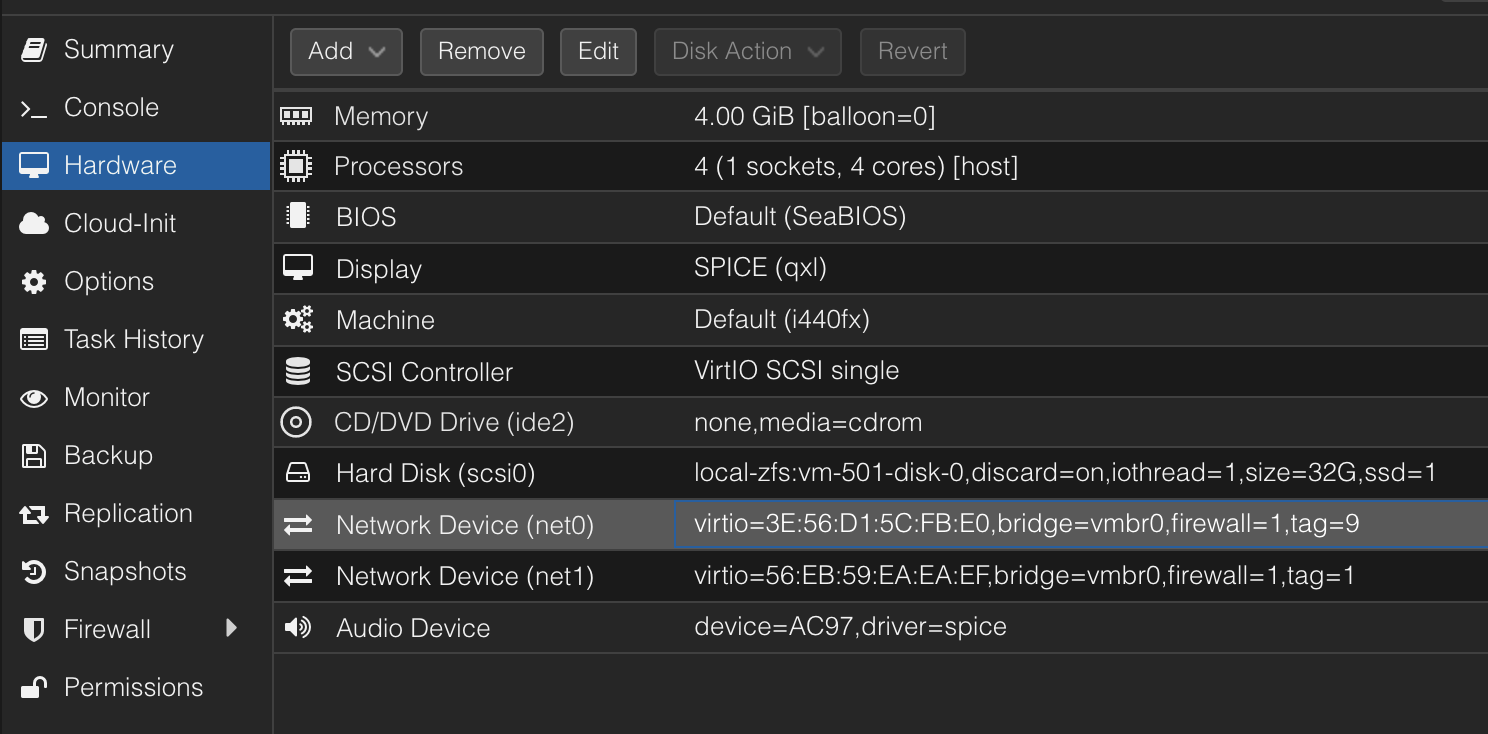
To do this, we need to know what interface on the Proxmox system corresponds to the net interface on our VM. Looking at the VM’s Hardware pane, we can see the net0 and net1 interfaces in this example. Take note of that number, it’s important.
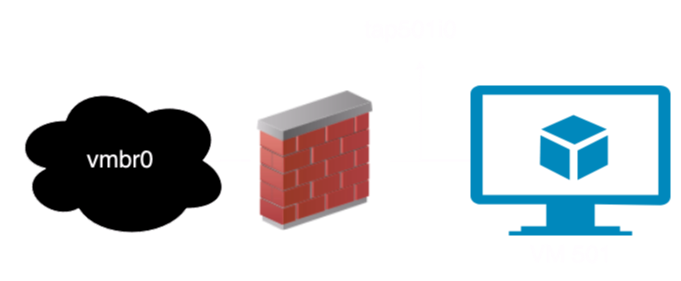
For net0 of VM 501, the Linux device we need to capture will be named tap501i0. This is located between the Proxmox firewall and the VM, if you have the firewall enabled (you probably should use it, it’s a great tool). Conceptually it looks like this:
So, finally, to capture traffic, run tcpdump from the Proxmox shell.
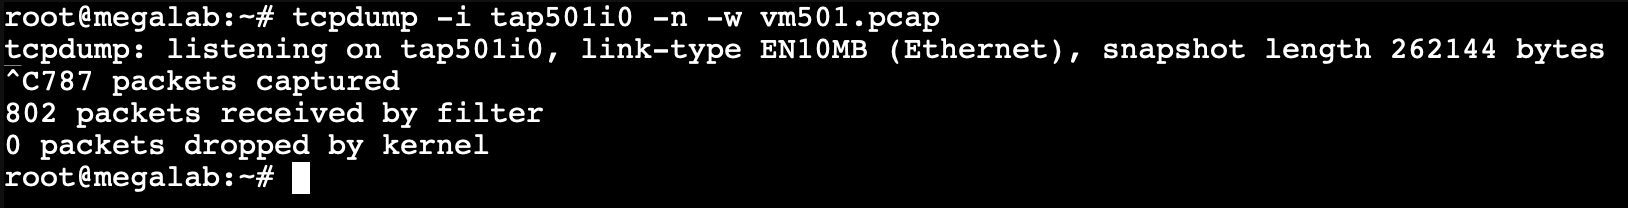
For this example, the command is tcpdump -i tap501i0 -n -w <filename>.pcap. You can use whatever file name you want. Use Ctrl+C when you are all done.
To copy the file off, you can use scp, or store move the file to a network location you have access to. Network storage in Proxmox is mounted at /mnt/pve/